
Various services of the municipality come together in the renovated Municipality Service Office of Tilburg. Previously, you could find them at different locations around the town. The Municipality Service Office is the place for all questions from residents about services, products and information related to the municipality.
The building is the business card for Tilburg as innovative town: accessible, transparent and sustainable. The matching client service also has a place within this context. What does it mean for the Municipality Service Office? How do you align the layout, team staffing and ups and downs in visitor numbers with each other?
Making goals achievable
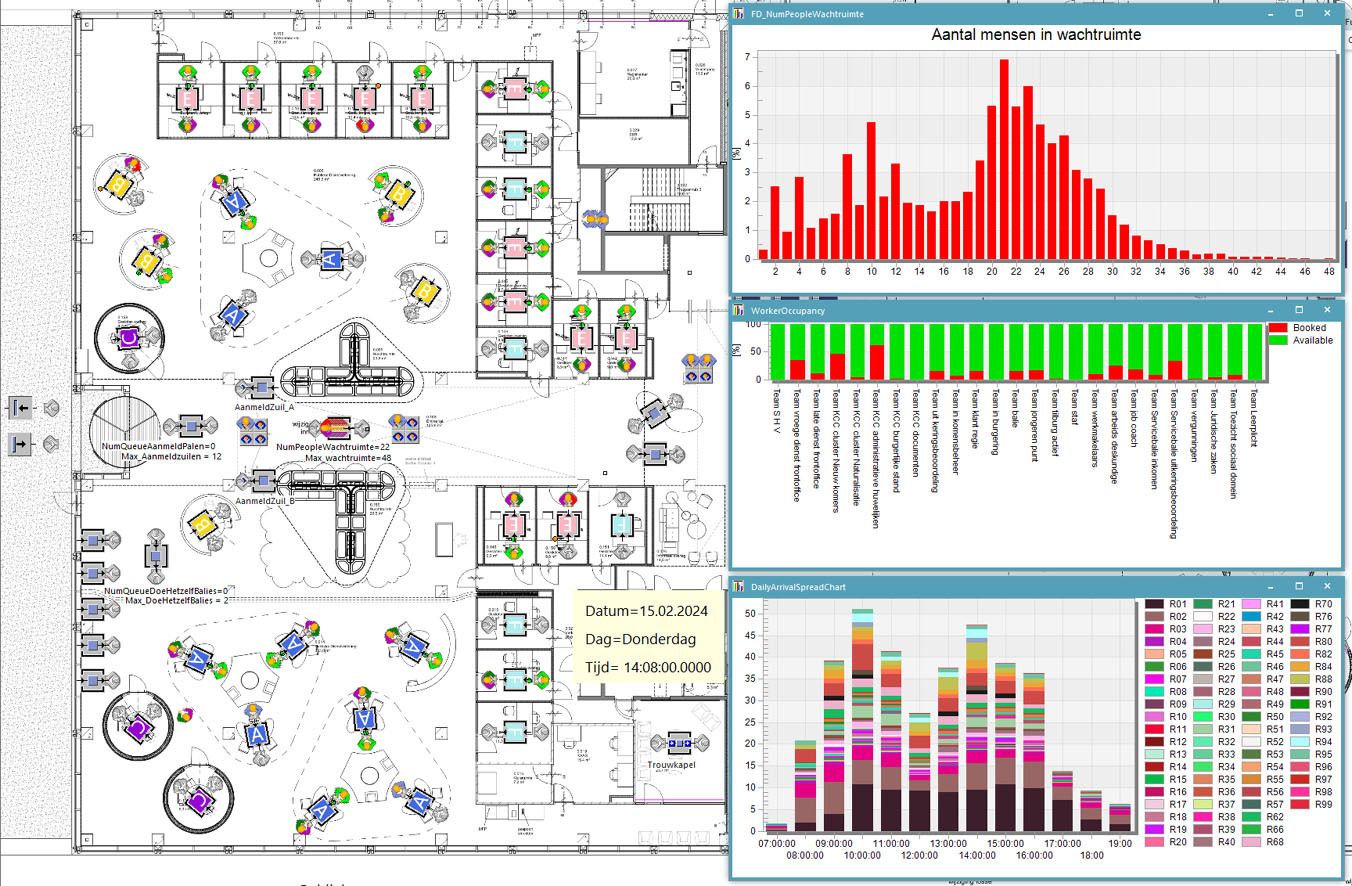
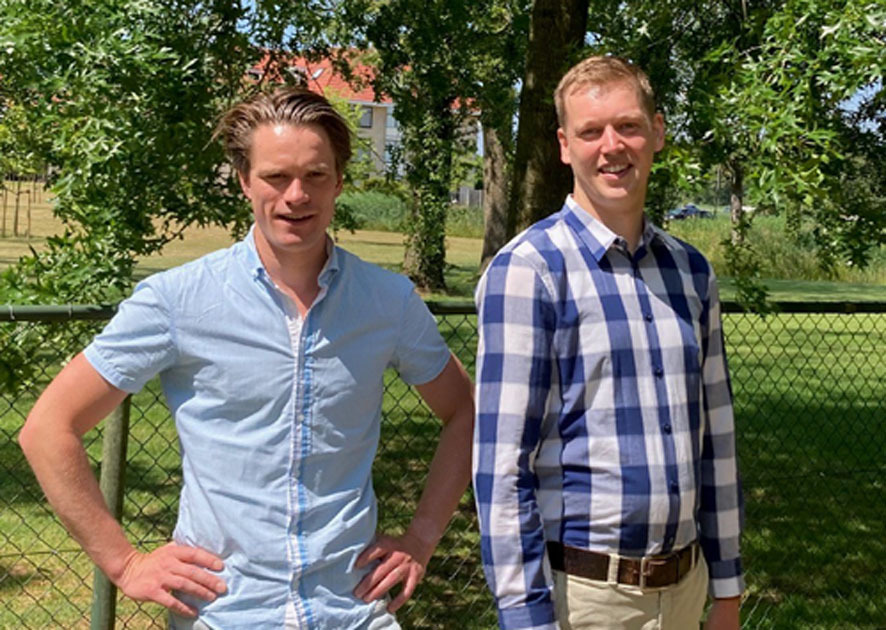
Senior Simulation Consultant Mart Bruggink and Junior Simulation Consultant Wouter van Dieren of VIRO’s Smart Model Based Systems Engineering (SMBSE): “The Municipality of Tilburg approached us to test the layout design by means of process simulation. The burning issue was: can all public departments achieve the required service level with this layout?” Mart gives the floor to Wouter: “He has basically delivered the entire project.” His colleague grabs the Municipality Service Office's floorplan: “On here, you can, for example, see the entrance, two registration points, a waiting room and a subdivision in consultation rooms with different colours. These rooms are for the various types of conversations with various graduations in privacy and security. In addition, you need to consider the team sizes of the departments, the client visits and the patterns that they display. We started to parameterise all this type of data.”
Sankey and simulations
Mart sees this as the artisanal part of the work: “You create a data model that you can also use specifically and in a comprehensible way to communicate with the client. The municipality can also adjust tables based on visitor numbers and team compositions. They can save and compare these reports.” The tables were filled in with all types of variables so that insight was obtained into various scenarios. Wouter created Sankey diagrams based on the tables: “The walkways of employees were drawn in. The thicker the lines, the more walking movements.” Wouter also carried out simulations: “The municipality validates in this way whether it can handle specific visitor numbers. It is easy to tweak the parameters during a simulation, it is intuitive and you visualise the results.”
Useful insights
What were the results of the project? “The municipality could validate that it can achieve specific service standards with the current team composition and building layout, but that this will become more difficult for some departments. They could also analyse what the size of the waiting room should be to deal with peak loads.”